The images below present JLN Engineers software development views and an illustrative FEA graphic. They describe development capabilities and do not provide public access to a working tool.
JLN FEA
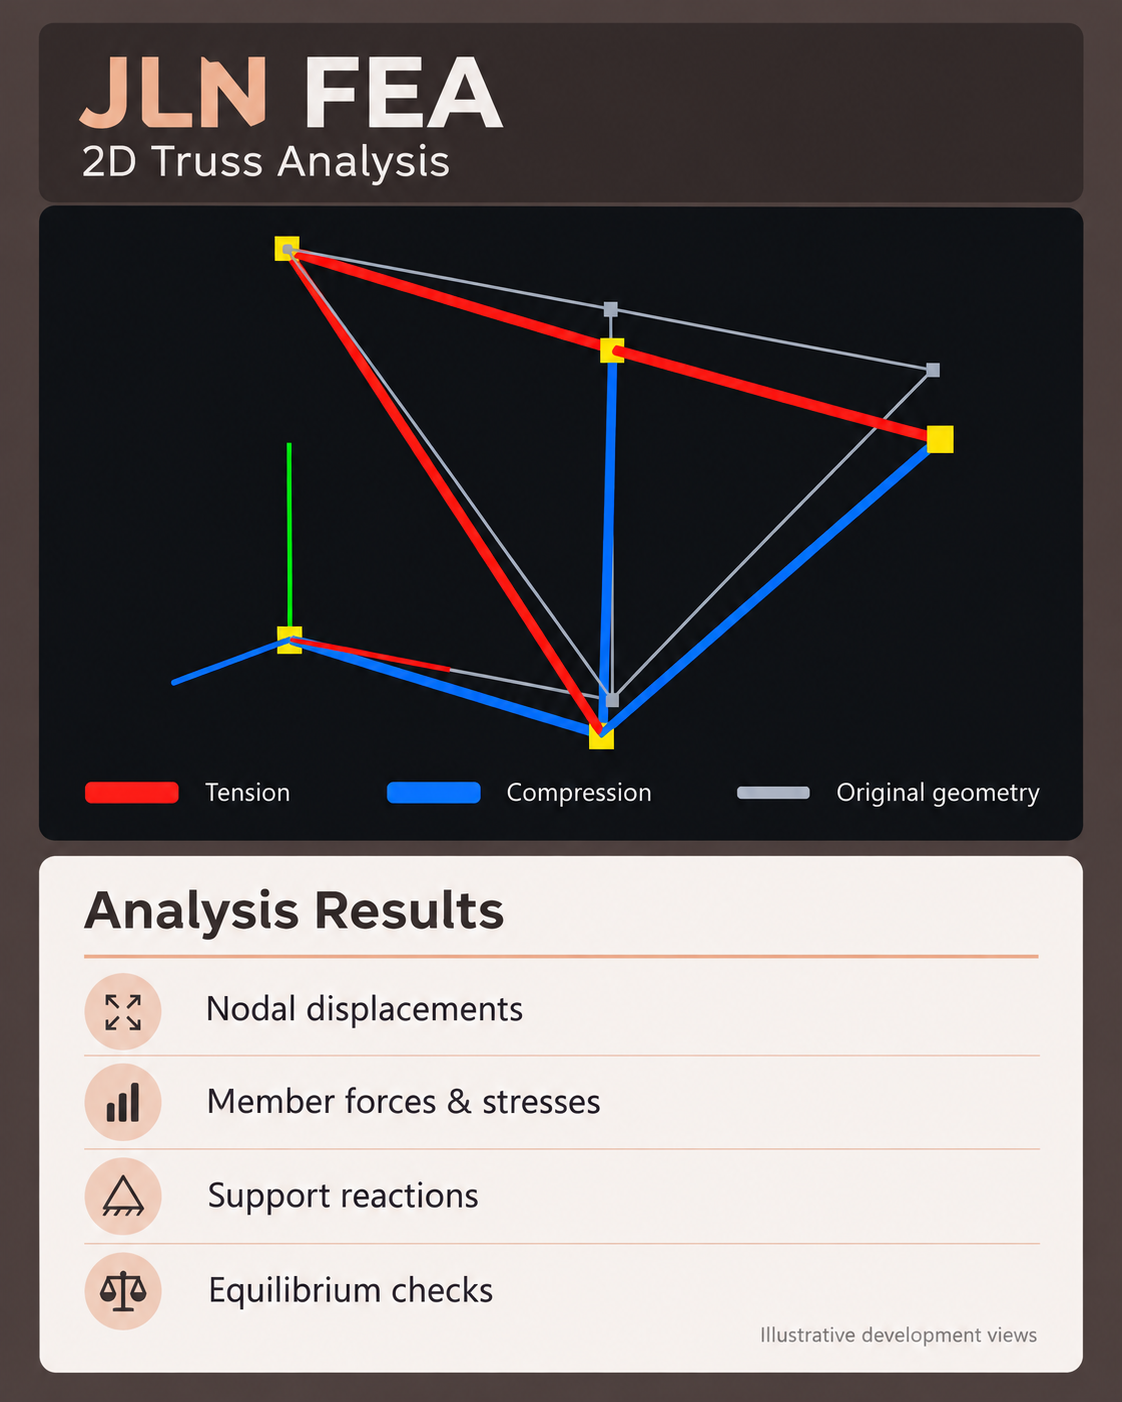
An illustrative 2D truss analysis graphic based on JLN FEA development views. The graphic summarizes analysis output categories; it is not a numerical calculation record.
JLN Analysis
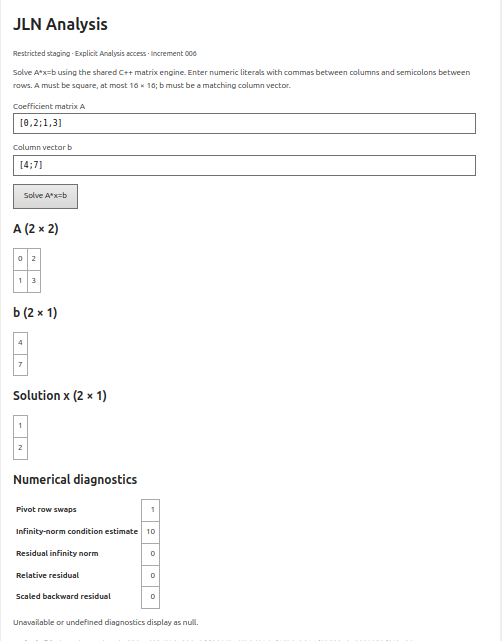
A demonstration matrix calculation with a solution and numerical diagnostics.
JLN DAQ
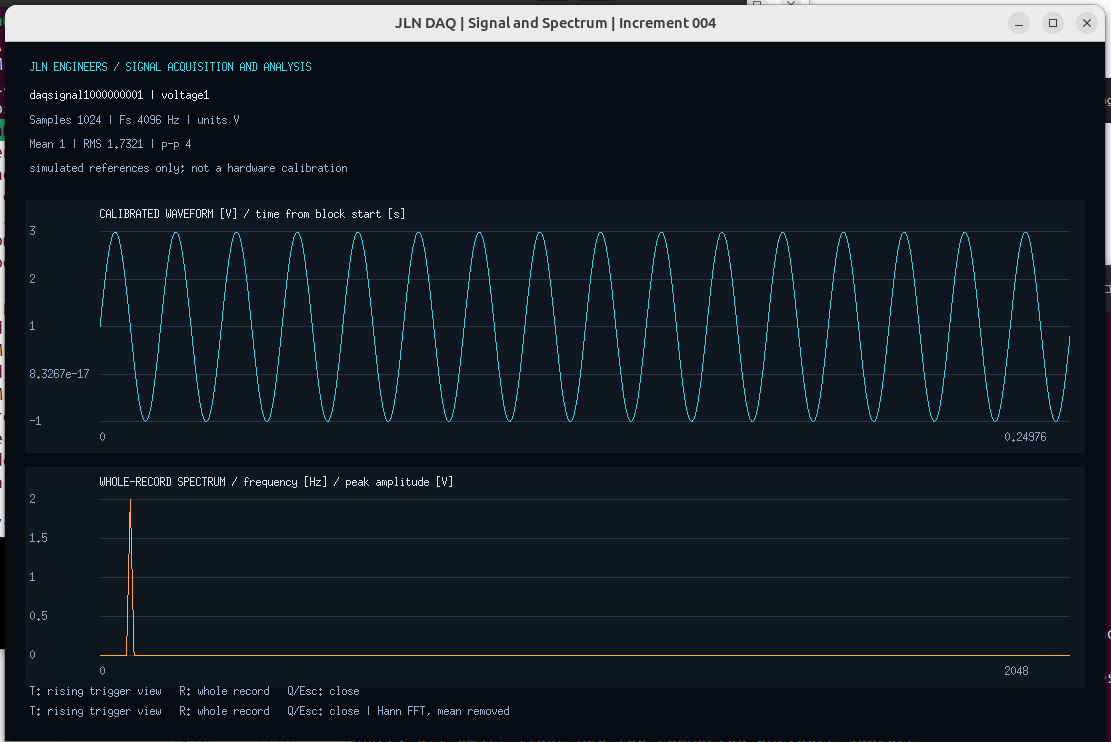
A desktop development preview displaying a simulated waveform and frequency spectrum. The image does not represent a hardware calibration.